Without some basic understanding of the factors affecting heat sink performance the heat sink you select may be inadequate to meet the thermal requirements of the device being cooled. This leads to an increased number of designs and testing iterations ultimately delaying the completion of the product development. There are 3 common mistakes that are made when evaluating a heat sink to be used.
1. Using the manufacturer’s thermal resistance to predict performance
The thermal resistance of a heat sink is the most common way to assess the performance of a heat sink for a given application. By multiplying the heat sink thermal resistance, Rth by the power dissipation, Q of the device being cooled and adding the ambient temperature, Tamb to the results, the case temperature of the device, Tc can be determined, as shown in equation 1. The typical method by which heat sinks are selected is to first calculate the required heat sink thermal resistance using equation 1. A search of commercially available heat sinks with published thermal resistances less than or equal to the calculated value is then conducted.

The thermal resistances provided by the heat sink manufacturers is typically determined through testing of a heat sink with a square heat source, usually 25.4 mm x 25.4 mm (1″ x 1″) attached to the center of the base of the heat sink with a predetermined heat dissipation value. The temperature difference is measured and using equation 1 and the thermal resistance is calculated.
Using this measured heat sink thermal resistance value can often times result in the selection of a heat sink that may not meet your thermal needs because the thermal resistance of the heat sink is not a constant. The thermal resistance of the same heat sink will change based on the size of the heat source relative to the base area of the heat sink. If the heat source you are using is significantly smaller than the heat source used by the manufacturer during testing of the actual heat sink the thermal resistance may be much higher than the manufacturer’s tested value. This is due to the difference in thermal spreading resistance which is caused by the flow of heat from the smaller area of the heat source to the larger area at the top surface of the heat sink. The smaller the heat source area relative to the base area of the heat sink the higher the thermal spreading resistance which then increases the overall thermal resistance of the heat sink. The effect of spreading resistance is most pronounced on heat sinks undergoing forced convection.
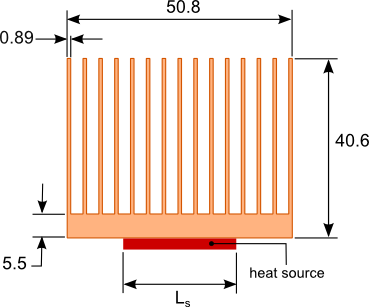 Figure 1. Sample heat sink
The graph in figure 2 shows the effect of source size on a heat sink cooled by forced convection. The dimensions of the heat sink profile are shown in figure 1. The length of the heat sink is 76.2mm (3″). The length and width of the heat source are identical and is given by Ls. The flow rate is 5 CFM, the heat dissipated by the source is 59 Watts and the ambient temperature is 30°C.
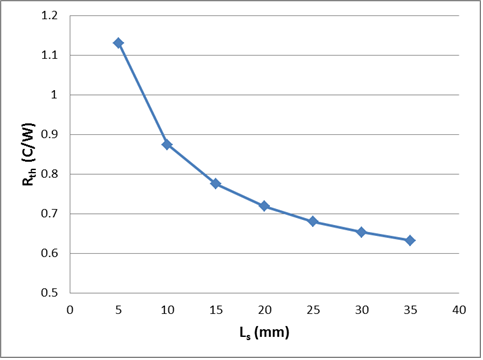 Figure 2. Effect of the heat source size on the heat sink thermal resistance
A further explanation of thermal spreading resistance associated with heat sinks can be found in the article: Simple Formulas for Estimating Thermal Spreading Resistance
The thermal resistance value of the heat sink provided by the manufacturer is typically for a heat sink of length 76.2mm or 3″. Caution shown be taken when trying to determine the thermal resistance for the same heat sink profile at a longer lengths. The thermal resistance does not increase linearly with length. As the length increases so does the spreading resistance since the ratio of the area of the source relative to area of the base of the heat sink decreases. Any gains in heat transfer from the heat sink due to the increased surface area are partially offset by the increase in spreading resistance. Additionally the rate of heat transfer from the heat sink due to convection decreases with increasing heat sink length. A further explanation of this will be presented in the next section.
2. Selecting a heat sink based solely on surface area
Quite often in articles or in engineering forums a value for heat dissipation per unit area will be given when trying to determine the required surface area of a heat sink. This would lead many to believe that simply increasing the heat sink surface area will improve the performance of the heat sink which is not the case. The heat sink performance is determined not only by the surface area but also by all the dimensions of the heat sink. The most critical of these is the spacing between the fins. The spacing between the fins has a huge influence on the rate at which heat is dissipated from the surface of heat sink. This is commonly referred to as the heat transfer coefficient, h. The combination of surface area, A and the rate of heat dissipation, h determines the surface temperature of the heat sink, Ts which is expressed mathematically in equation 2.

where:

As the spacing between the fins is decreased at some point the heat transfer is negatively affected. This is due to an increase in the thermal boundary layer thickness The boundary layer is best described as the region adjacent to the surface of the heat sink where the temperature of the air is higher than temperature of the ambient. As shown in figure 3 the thermal boundary layer is thinnest when the air just enters the space between the fins and grows along the length of the fins in the direction of the air flow. The closer the spacing between the fins the sooner the thermal boundary layer from the adjacent fins merge. This creates a region of higher temperature air that reduces the rate of heat transfer from the heat sink surface to the air within the channels formed by the fins. In order to achieve the lowest heat sink temperature and hence the lowest temperature of the source being cooled there has to be a balance between spacing of the fins and surface area of the heat sink.
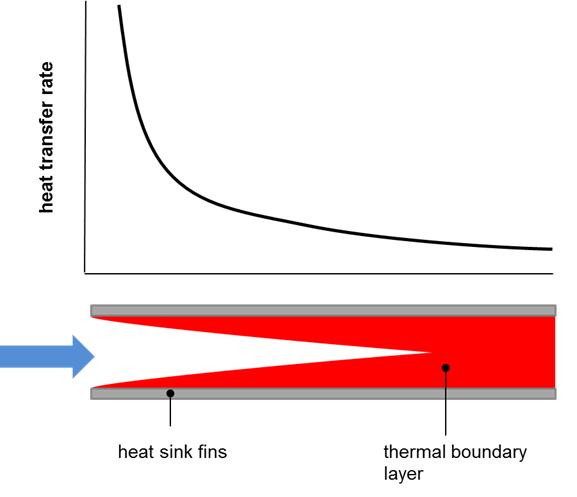
Figure 3. The effect of heat sink fin spacing and length on the rate of heat transfer
The thickness of the boundary layer is also proportional to the rate of heat transfer. This indicates that shorter heat sinks will perform better than taller heat sinks with the same fin spacing and surface area. The blog post: Sizing a heat sink with a few simple equations provides an overview of some of the calculations that can be used to determine the optimum fin spacing for a natural convection cooled heat sink.
To illustrate the importance of proper fin spacing let’s take a look at the variation of the heat sink thermal resistance versus the number of fins for the heat sink shown in figure 1. The base of the heat sink is oriented vertically and the heat transfer is via natural convection. Radiation will be ignored in this example. The length and width of the heat source are Ls=25.4 mm. The heat dissipated by the heat source is 20 Watts. The graph in figure 4 shows how critical fin spacing is particularly in natural convection to the performance of the heat sink. What should be noted is that the optimum heat sink design with 8 fins has a surface area 0.045 m2 and the original design with 15 fins has a surface area of 0.084 m2 and a thermal resistance that is significantly higher.
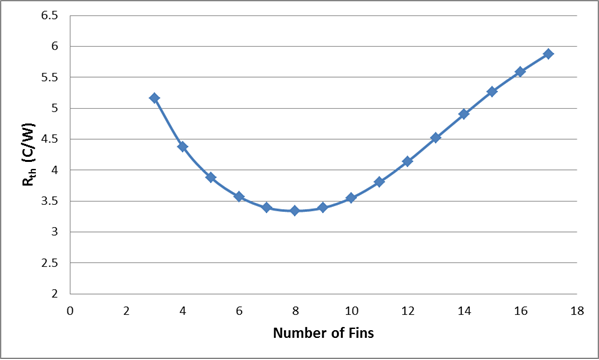 Figure 4. Variation of heat sink thermal resistance with the number of fins
3. Using the maximum fan flow rate to estimate the heat sink performance
A cooling fan manufacturer will typically state the maximum fan flow rate when listing the performance of the fan. This is misleading for those who are not familiar with how the fan will operate once it is placed in front of a heat sink.
The flow rate of a fan is inversely proportional to the pressure drop across the fan shown in figure 5. The maximum flow rate will occur when the pressure drop across the fan is zero. This occurs only when there are no obstructions in front of, or behind the fan thus allowing the air to flow freely into and out of the fan. Once an obstruction such as a heat sink is placed in front of the fan there is some positive pressure drop across the fan. The more the obstruction blocks the flow of air from the fan the larger the pressure drop. Figure 5 shows the pressure versus flow rate graph for a typical fan used in electronic cooling. The larger the pressure drop across the fan the lower the flow rate provided by the fan.
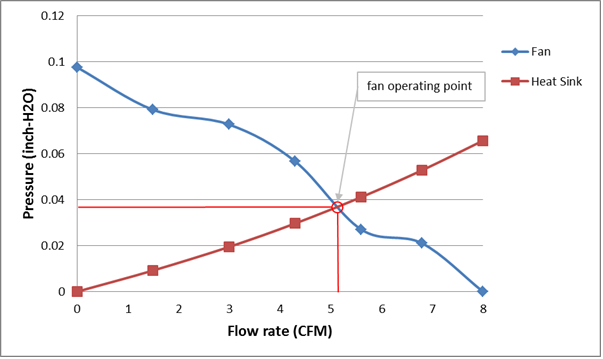 Figure 5. Fan and heat sink pressure versus flow curves
Heat sinks that have a higher fin density will provide more flow resistance resulting in a higher pressure drop across the fan and a lower air flow rate. The operating point of the fan is the intersection of the fan pressure versus flow curve with the pressure versus flow curve of the heat sink as shown in figure 5.
The selection of a fan and heat sink is a trade off between the flow rate that the fan will provide and a heat sink design that will have the maximum heat transfer rate based on the provided fan flow rate.
